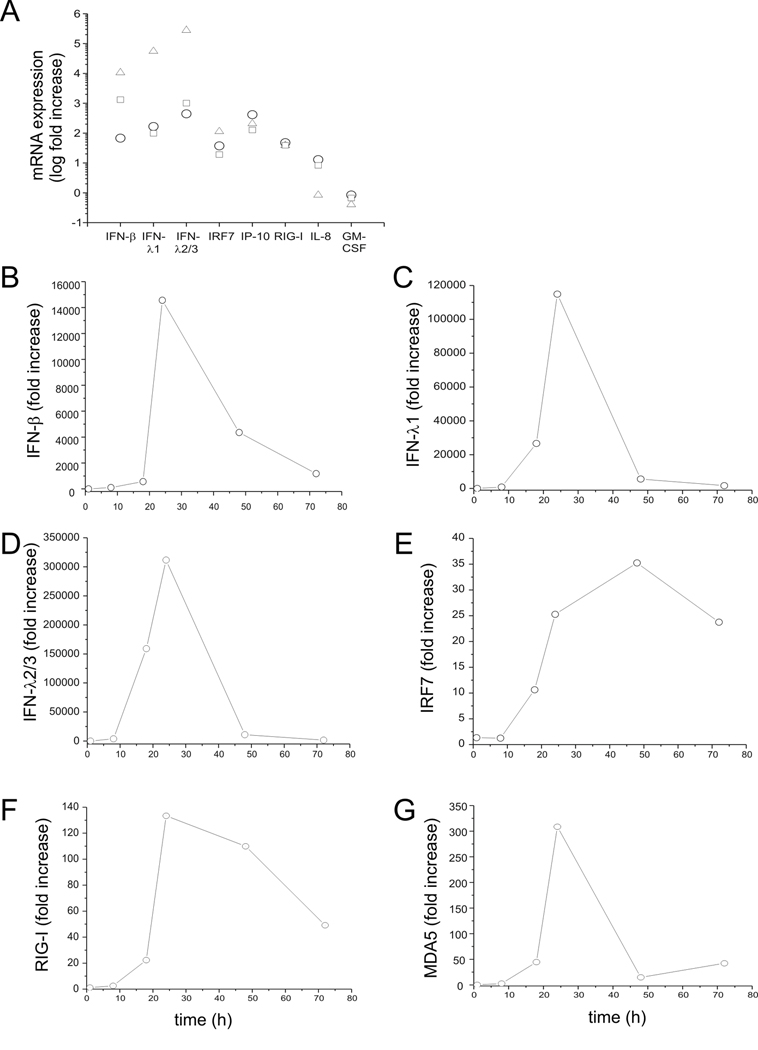
Figure 3. RV1B-induced expression of IFNs, ISGs and chemokines in primary tracheobronchial epithelial cells.
Primary tracheobronchial epithelial cells were grown to near confluence and infected with RV1B or sham. A. Total RNA was extracted twenty-four hour after infection, and the expression of IFN-β, IFN-λ1, IFN-λ2/3, IRF7, IP-10, IL-8 and GM-CSF determined by qPCR. Expression levels are represented as the ratio of the response to intact RV vs. the response to sham. The y-axis is in log scale. B–G. Time course of RV1B-induced responses in primary cells.

