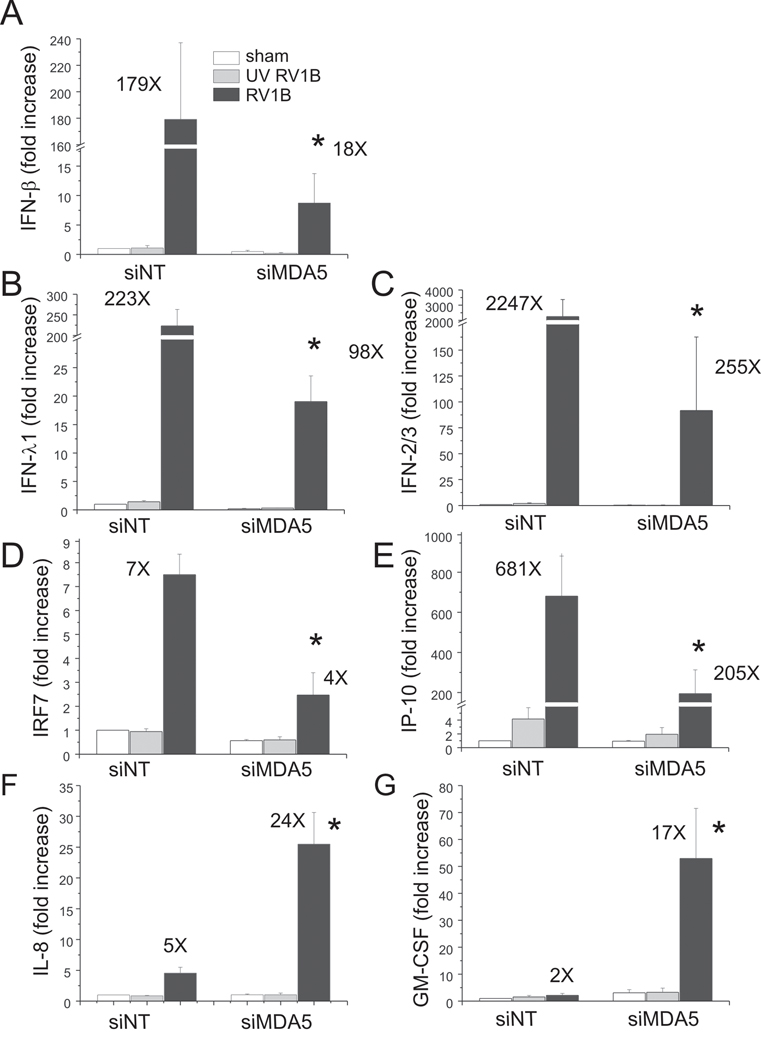
Figure 6. siRNA against MDA5 blocks RV1B-induced IFN and ISG expression.
A–G. Total RNA was extracted and the expression of IFN-β, IFN-λ1, IFN-λ2/3, IRF7, IP-10, IL-8 and GM-CSF was determined by qPCR. The expression of each target gene was normalized to GAPDH. Expression levels are represented as the fold increase vs. sham-infected, non-targeting siRNA-transfected cells. The y-axis has been broken in order to show the effects of siRNA on both basal and maximal gene expression. Bars represent mean ± SEM for five experiments; numbers on top of bars indicate the fold increase compared to sham-infected sample within its own siRNA group. (*p<0.05 vs. MDA5 siRNA-transfected RV-infected sample, ANOVA.)

