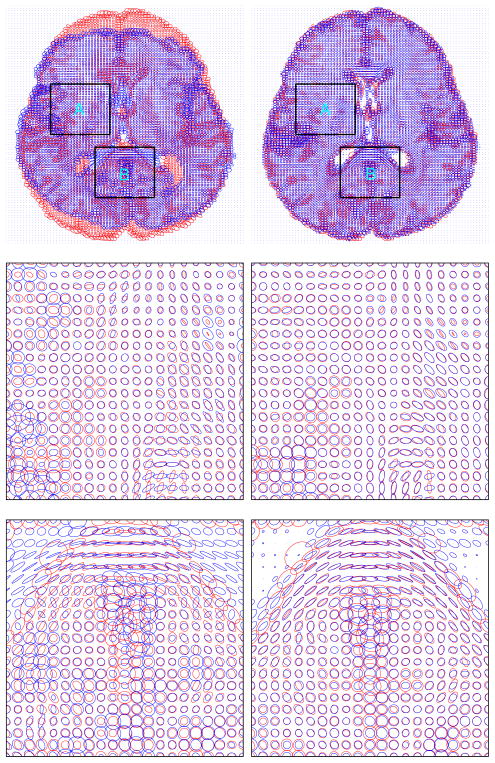
Figure 1.
3D tensor matching of two normal human brains. Left column shows the tensor distribution of slice 30 before matching; Right column shows the tensor distribution of slice 30 after matching. Template and target are superimposed with blue color the template and red color the target. First row shows the whole slice. Second row and third row shows the enlargement of region A and region B respectively.

