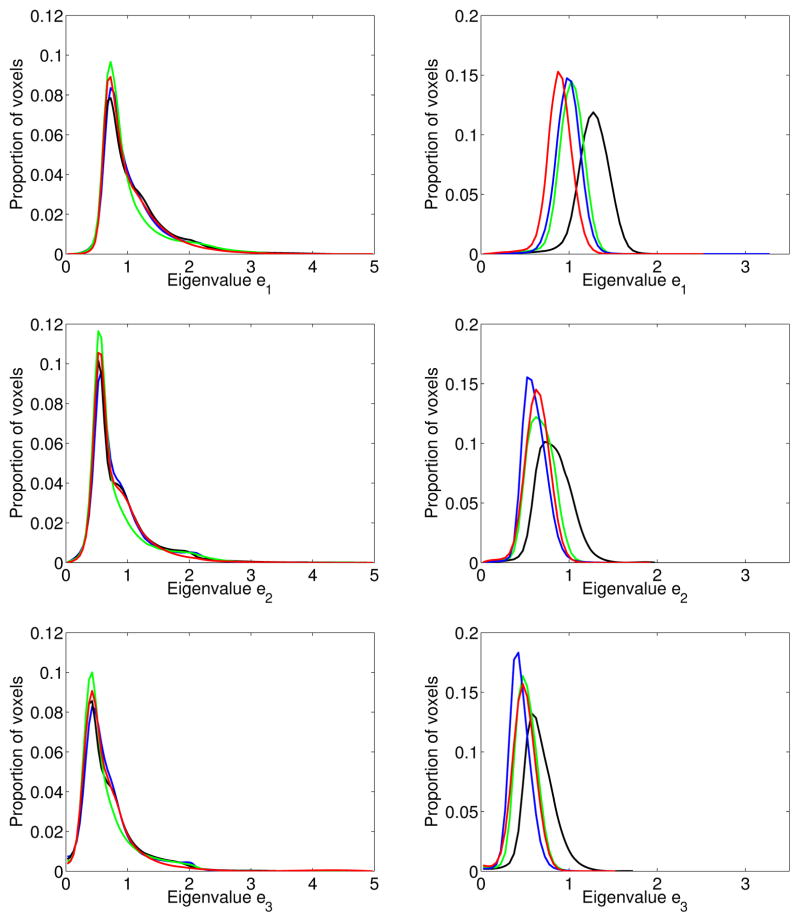
Figure 4.
Left column shows the histogram of 3 tensor eigenvalues for several normal human brain DT-MRI datasets, right column shows the histogram of 3 tensor eigenvalues for several normal canine heart DT-MRI datasets. Same color means the same dataset. This figure shows sometimes it necessary to normalize the eigenvalues of the tensors before matching.

