
Figure 5.
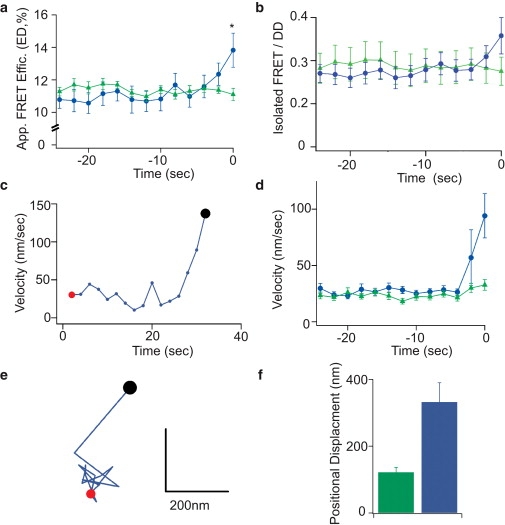
Dynamic interaction of Rab27A-GTP with Slp4A on insulin granules. For plots of FRET indices, individual granule time courses were aligned to time of disappearance (time = 0) before averaging. Nonresponders (green triangles) were aligned to similar time points as responders (blue circles) from each cell and averaged. (a) Time course of apparent FRET efficiency ED before granule disappearance. (b) Time course of isolated FRET/DD before granule disappearance. (c) X-Y velocity versus time relationship for a representative responder granule, and (d) averaged over the granule populations. (e) X-Y positional trajectory of a representative responder granule, from the initial time point (red circle) to the time point before disappearance (black circle), and (f) positional displacement expressed as ratio of final/initial position averaged over the granule populations.