
Figure 4.
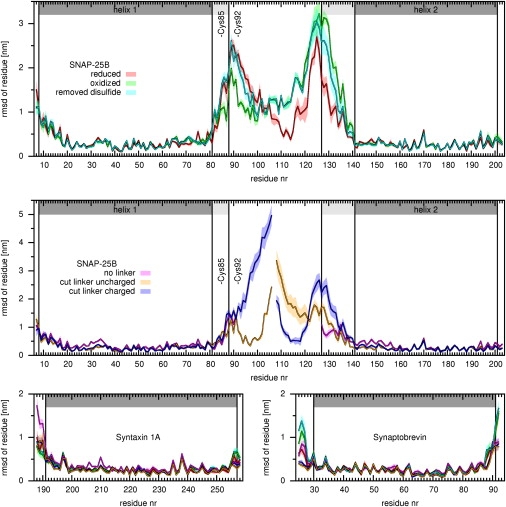
Structural deviation for the different setups discussed in the text (colors): Shown are mean RMSD values (bold lines) and standard errors (shaded area) of each residue, determined from all five simulations of each setup and averaged over the final 40 ns. (Medium- and light-shaded background) The helical part of the crystal structure and the modeled helix ends, respectively.