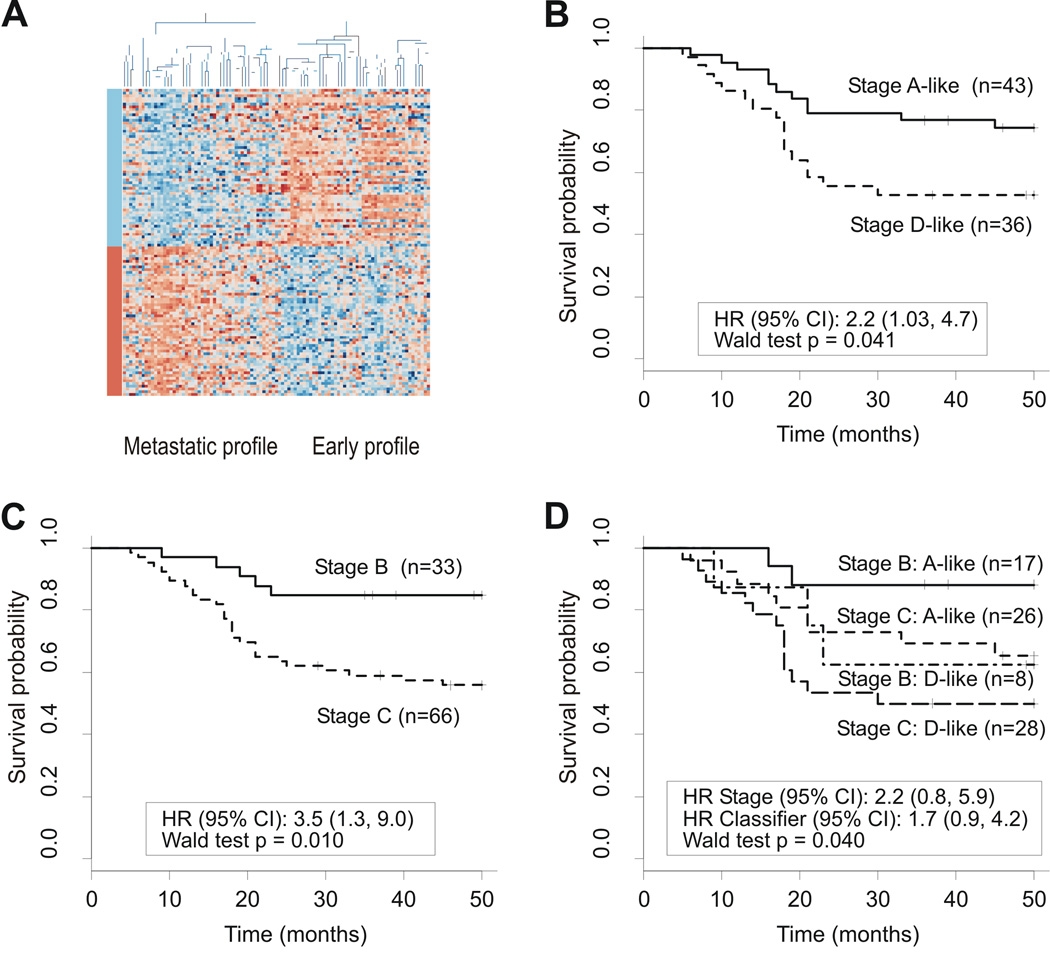
Fig 3.
External prognosis classifier validation (Danish dataset). (A) Unsupervised clustering using metastasis-associated genes represented on HG-U133A GeneChip arrays. Samples are arranged along the x-axis and genes along the y-axis. Each square represents the expression level of a given gene in an individual sample. Orange represents increased expression and blue represents decreased expression relative to the mean- and sample-centered scaled expression of the gene across the samples. Genes are grouped into those found to be down-regulated (blue) and up-regulated (orange) in metastatic cancers as compared to early-stage cancers as represented by the color bars. The two main groups resulting from clustering show early-stage and metastatic profiles as indicated. (B) Survival curves generated using PAM classification show a significant difference in outcome. Class predictions with a >90% probability were scored. (C) Survival curves using Dukes’ staging criteria show a significant difference in outcome. (D) Survival curves grouped by both Dukes’ stage and molecular signature show that both stage B and C patients can be further subdivided into good and poor prognosis groups.

