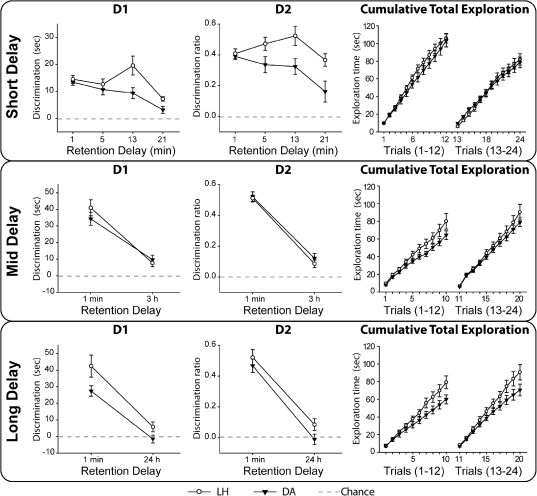
Figure 3.
Experiment 1, Stage 2: Object recognition with Short (top; 5-, 13-, 21-min), Mid (middle; 3-h), and Long (bottom; 24-h) retention delays. (Left) D1 score; (middle) D2 ratio; (right) total exploration for all objects. For the Short Delay, each mean D1 and D2 score is taken from a block of four trials. Retention intervals increased by 2 min for every trial after Trial 12. The data were, therefore, blocked into three groups of four trials (Trials 13–16, 17–20, 21–24), with respective mean retention intervals of 5, 13, and 21 min. For the Mid and Long delays, each mean D1 and D2 score is taken from 10 trials. (Black symbols) Dark Agouti rats (DA), (white symbols) Lister Hooded rats (LH). For D1 and D2 scores, a score of zero reflects a failure to discriminate novel from familiar (chance). (Vertical bars) Standard error of the mean (although when small, they are obscured by the symbols).

