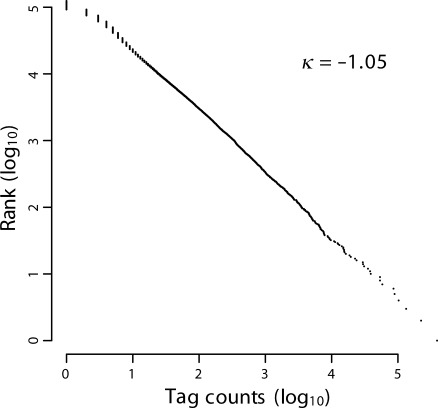
Figure 1.
Statistical profile of TSSs in T. gondii. Counts of each unique tag were converted to a logarithm and plotted on a horizontal axis. The rank of the tag according to its counts was converted to a logarithm and plotted on a vertical axis; 440 609 tags consisting of 124 217 TSSs were examined.

