Figure 3.
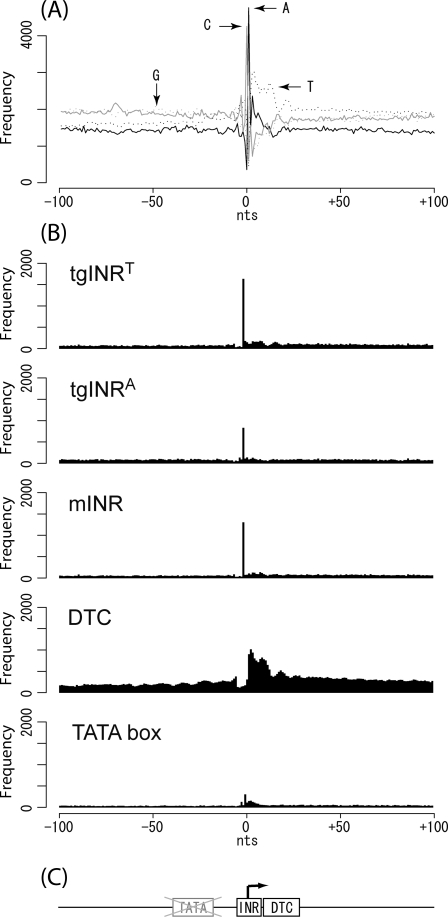
Core promoter structure in T. gondii. (A) Distribution of the nucleotide in the core ± 100. The core promoter area ±100 nucleotides around the TSS is shown on a horizontal axis, and the observed frequency is plotted on a vertical axis. The black line, dotted black line, grey line, and dotted grey line represent the occurrence frequency for adenine, thymine, cytosine, and guanine, respectively. (B) Distribution of motifs in the core ± 100. Their PWM and threshold applied for evaluation are described in the text. (C) Model of the core promoter structure in T. gondii. The two boxes represent the tgINRs consensus sequence and DTC. An arrowhead represents a TSS. The region where the TATA box should be is shown by a crossed-out grey box.

