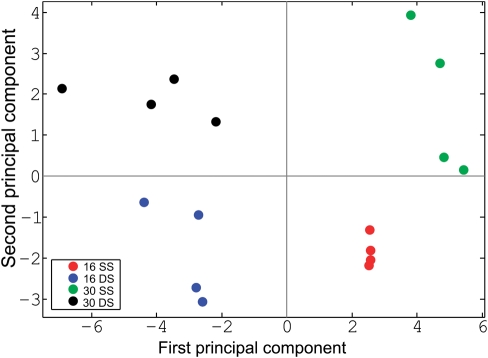
Figure 3.
Principal component analysis of the relative abundances of 132 proteins selected for MS-based quantitative analysis. Experiments are colour-coded as follows: red, 16 nt single-stranded (ss) DNA probe, starving cells; blue, 16 bp ds DNA probe; green, 30 nt ss DNA probe; black, 30 bp ds DNA probe.

