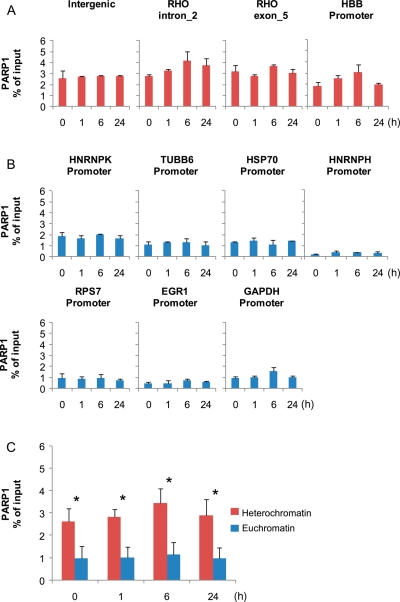
Figure 6.
Distribution of PARP1 at heterochromatic and euchromatic sites. HeLa quiescent (0 h) and serum-treated cells (1, 6, and 24 h) were used in ChIP assays with antibodies against PARP1. Isolated DNA was used in real-time PCR with primers to the intergenic site, two sites within the RHO gene, and the promoter of HBB (A), as well as the promoters of HNRNPK, TUBB6, GAPDH, HNRNPH, RPS7, HSP70, and EGR1 (B). Data are expressed as percent of input chromatin and represent the mean ± sd of four independent experiments. (C) The comparison of PARP1 abundance at heterochromatic and euchromatic sites. The data represent an averaged % of input for all heterochromatin and euchromatin genes tested separately for each time point. The differences between heterochromatin and euchromatin in PARP1 occupancy were statistically significant (*P < 0.005; unpaired t-test) for all time points tested.

