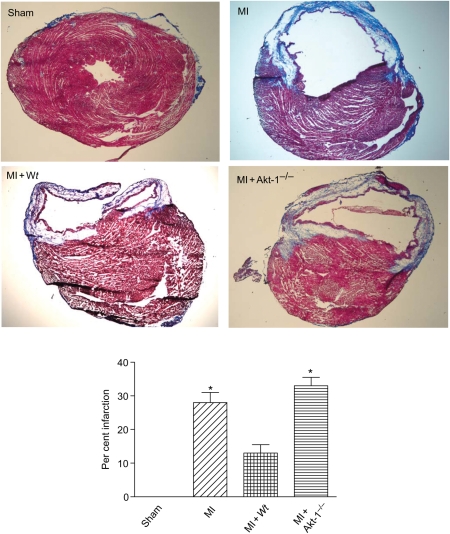
Figure 2.
Percentage of myocardial infarct size for sham, MI, MI + Wt stem cells, and MI + Akt-1−/− stem cell-treated hearts. Upper panel shows representative images of different groups, and low panel shows the percentage of infarct size among the groups. Values are mean ± SEM (n = 3 per group). *P < 0.05 vs. sham and MI + Wt stem cells.

