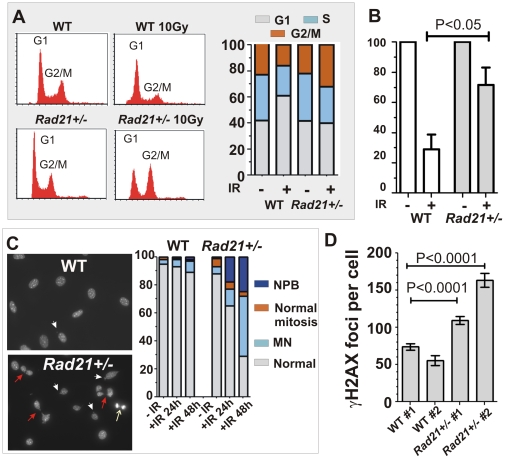
Figure 2. Radiation-induced DNA damage response of Rad21+/− cells.
A. Cell cycle profiles of WT and isogenic Rad21+/− MEFs. Cells were analysed 24 hours post 10Gy IR, with unirradiated cells as controls. DNA content was used to determine the proportion of cells in different cell cycle phases. B. Change in the percentage of S-phase cells 24 hours post 10Gy IR. BrdU-positive cells were expressed as the percentage of unirradiated controls. Data represent means of three independently-derived MEF cell lines for each genotype. Error bars = SEM. C. Radiation-induced genomic instability. Nuclei were visualised by DAPI staining and scored at indicated time-points post 10Gy IR, for the presence of nucleoplasmic bridge (NPB, red arrows), micronuclei, MN (white arrowheads) and normal mitoses (white arrow). Also see Figure S4. The number of nuclei scored was as follows: WT unirradiated n = 643, 24 hours post IR n = 1131, 48 hours post IR n = 263; Rad21+/− unirradiated n = 782, 24 hours post IR n = 1298, 48 hours post IR n = 246. D. Quantification of radiation-induced γH2AX foci 4 hours post 10Gy IR. Two independently-derived WT and isogenic Rad21+/− MEF cell lines were used. The number of nuclei scored was as follows: WT #1 n = 172, WT #2 n = 303; Rad21+/− #1 n = 232, Rad21+/− #2 n = 104. Error bars = SEM.

