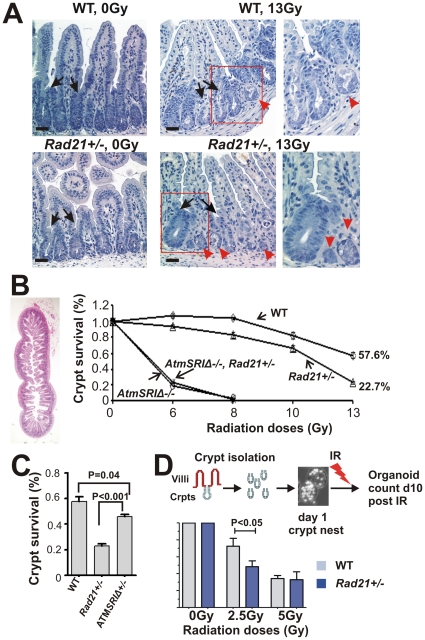
Figure 4. In vivo and ex vivo small intestinal crypt survival following radiation exposure.
A. Hematoxylin-stained transverse sections of small intestines. Representative images of small intestinal crypts of unirradiated and irradiated animals. Irradiated samples shown were obtained at 3.5 days post 13Gy WBI. Non-surviving crypts are indicated by red arrowheads and surviving crypts by black arrows. Right panels: enlarged images from boxed areas. Scale bars = 20 µm. B. Crypt survival determined by the microcolony assay. Surviving crypts were counted 3.5 days post WBI at incremental doses as shown, in at least six whole circumferences of small intestine cross-sections (left panel) and expressed relative to unirradiated animals. The number of animals used for each data point is listed in Table S1. Error bars = SEM. C. Comparison of crypt survival in Rad21 and Atm mutant animals 3.5 days post 13Gy WBI. WT and Rad21+/− data shown areas in B. The number of animals used is as follows: Rad21+/−: n = 7; AtmSRIΔ+/− : n = 5; WT: n = 7. Error bars = SEM. D. Ex vivo crypt organoid survival. Diagrammatic presentation of the assay is shown above the graph. Day 1 organoid nuclei were visualised with Hoechst 33258 to show live cells. Data represent the percentage of organoids formed 10 days post IR at the doses indicated relative to unirradiated controls. The number of animals used is as follows: WT: n = 5; Rad21+/−: n = 7; four replicates were counted for each animal. Error bars = SEM.

