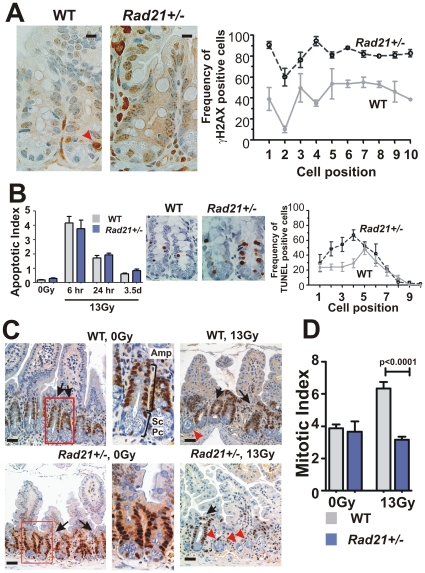
Figure 5. Cellular properties of small intestinal crypts post 13 Gy WBI.
A. γH2AX immunostaining of small intestinal crypt 6 hours after IR. Representative images of WT (left panel) and Rad21+/− (middle panel) are shown. The right panel shows the frequency of γH2AX-positive cells scored according to the cell positions relative to the base of crypts. At least 20 crypts per animal and three animals per genotype were scored. Red arrowhead: apoptotic cells. Scale bars = 20 µm. B. Apoptotic cells determined by TUNEL staining at indicated time points post IR. Middle panels show the representative images of TUNEL-positive cells in crypts 6 hours post IR. Right panel show the frequency of TUNEL-positive cells, scored according to cell position. At least 20 crypts per animal and three animals per genotype were scored to determine the frequency. C. PCNA immunostaining of crypts 3.5 days post IR. Middle panels: enlarged images of boxed areas showing three compartments of a crypt: Paneth cells (Pc), putative stem cells (Sc) and transient amplifying cells (Amp). Black arrows: surviving crypts; Red arrowheads: non-surviving crypts. Scale bars = 20 µm. D. Mitotic indices determined by phospho-Histone H3 immunostaining at 3.5 days post IR. At least four whole circumferences of small intestinal cross-sections were scored per animal. The number of animals scored is as follows: WT 0Gy n = 5, 13Gy n = 6; Rad21 +/− 0Gy n = 3, 13Gy n = 10. Error bars = SEM.

