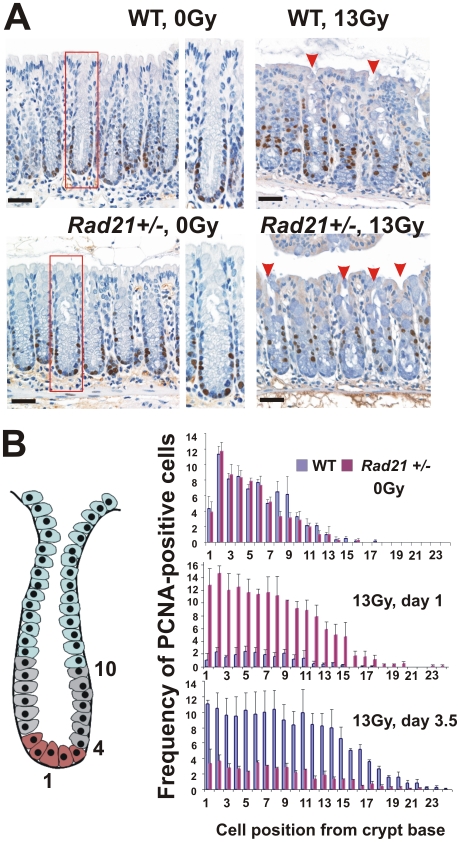
Figure 6. Kinetics of crypt epithelial cell proliferation in the large intestine post 13Gy WBI.
A. Representative images of PCNA immunostained crypts at 3.5 days post IR. Middle panels: enlarged images of boxed areas. Red arrowheads indicate full-length crypts. Scale bars = 20 µm. B. Quantitative analysis of the frequency of PCNA-positive cells per 20 crypts at indicated time points post IR. Cell positions shown are relative to the bottom of crypts. The right panel shows a diagram of a typical colonic crypt. Three epithelial compartments shown are: stem/progenitor cells (brown); transit amplifying cells (grey); differentiated cells (light blue). Three animals were scored per data point. Error bars = SEM.

