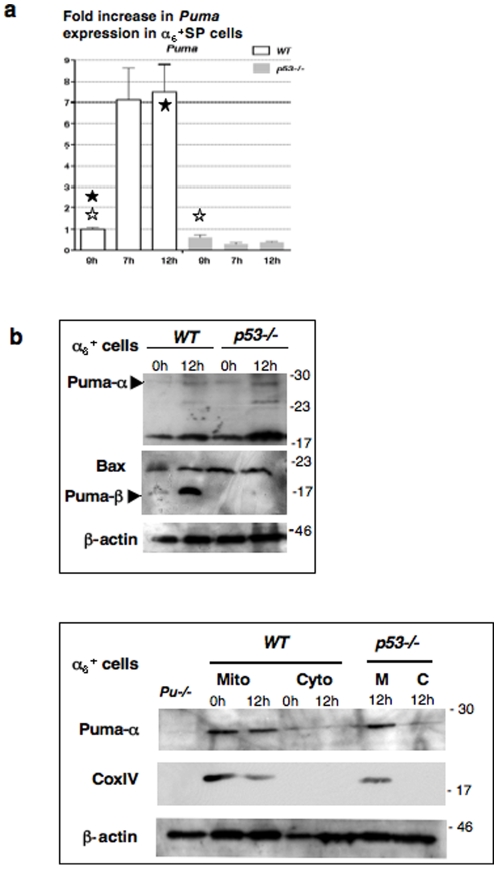
Figure 3. Increased Puma gene expression in a p53-dependent manner in α6 +SP cells.
(a) Comparison in WT or p53−/− sorted CD45−α6 +SP cells (highly enriched in spermatogonia) by semi-quantitative RT-PCR prior to, 7 and 12 hours after irradiation. Each expression level was normalized to its value in non-irradiated WT cells and is indicated as a fold increase (± SEM, three separate experiments from pooled CD45− α6 +SP populations, which were independently purified from 5 WT and 3 p53−/− mice). A significant difference in Puma expression level was observed in WT α6 +SP cells before irradiation and 12 h post-IR (black star, p = 0.015), and the basal level was significantly reduced in p53−/− α6 +SP cells (white star, p = 0.00074). See Figure S3 for complete semi-quantitative RT-PCR analysis. (b) Puma expression in α6 + cells (testicular cell fraction enriched in spermatogonia after immunomagnetic purification) was determined by western-blot analysis. The α isoform was identified on the upper picture with the 9643 antibody, using Puma−/− cell lysate as a negative control and according to Callus and col. [41]. The Puma-β isoform was detected with the 4976 antibody and β actin was used as loading control. On the last picture, testicular α6 + cells were collected prior and 12 h post-IR, and separated into cytosolic and mitochondrial-enriched fractions for puma-α location and expression level; the sample purity was assayed using an anti-Cox IV antibody (mitochondrial marker) and β actin as loading control. Data presented are representative of 2 independent experiments and each α6 + population was purified from 3 males.

