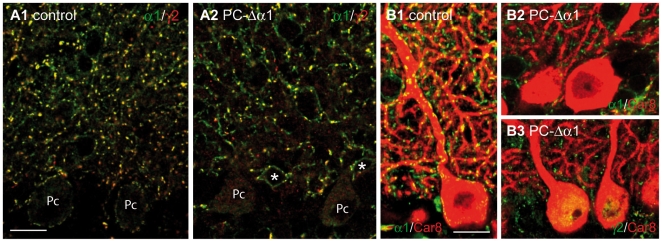
Figure 1. Loss of GABAARs from Purkinje cells of PC-Δα1 mice.
(A1,A2) Confocal images showing the distribution of GABAARα1 (green) and GABAARγ2 (red) in the cerebellar cortex of control (A1) and PC-Δα1 mice (A2). Note that in both conditions most GABAARγ2-positive clusters colocalize with the α1 subunit. A few clusters labelled for GABAARγ2 but not for GABAARα1 likely represent synapses containing α3-GABAARs. No surface labelling is visible in Purkinje cells (Pc) of PC-Δα1 mice, whereas MLIs (asterisks) are recognized by extrasynaptic labelling of the α1 subunit (A2). Double-labelled clusters (yellow) identify postsynaptic GABAAR aggregates on the cell body and the dendrites of MLIs (A2). (B1) Clustered distribution of GABAARα1 (green) in control Purkinje cells labelled for Car8 (red). (B2,B3) GABAAR clusters (B2: GABAARα1; B3: GABAARγ2) are not visible in Purkinje cells of PC-Δα1 mice. Scale bars: 15 µm.

