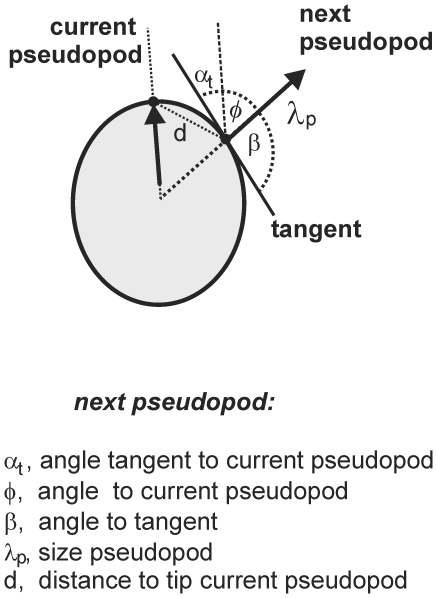
Figure 1. Pseudopod analysis.
Movies at a rate of 1 frame per second were recorded for Dictyostelium cells moving on a solid support in buffer. The program Quimp3 represents the cell outline using a polygon of ∼150 nodes, and then identifies extending convex protrusions as pseudopodia, described by the x,y,t coordinates of the start and end of their growing phase. The program also calculates the tangent to the surface at the position where the pseudopod started. These data were used to calculate for each pseudopod the size λ, the angle α relative to a specific point in space, the angle β relative to the tangent, and the angle ϕ relative to the previous pseudopod.

