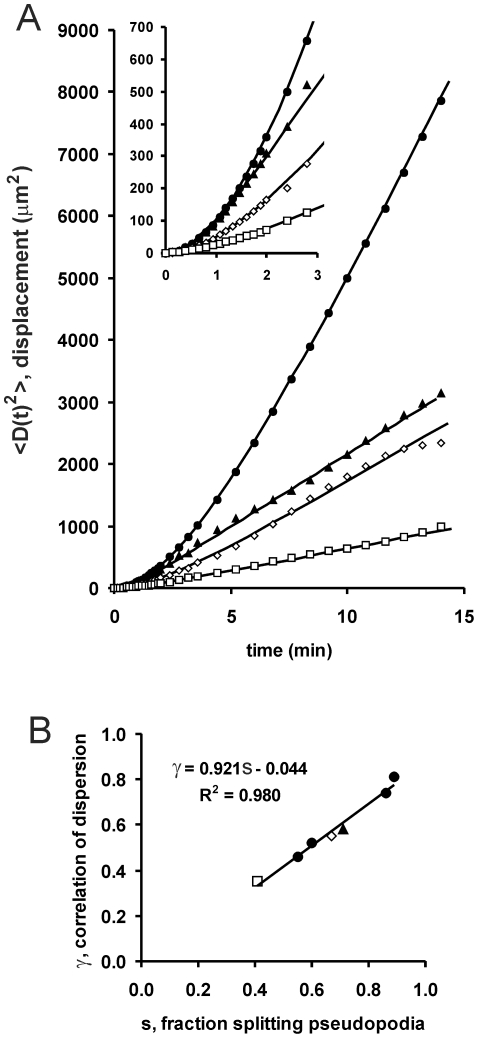
Figure 3. Dispersion.
The trajectories of wild type and mutant cells (see Fig. S1) were recorded as described in the method section. A. The mean square displacement was determined for ∼20 cells (symbols). The data were fitted according Eq. 4 (lines) yielding the correlation factor of dispersion γ obs as indicated in Table 1. B. The correlation factor of dispersion is plotted as a function of the fraction s of splitting pseudopodia, which was determined from the same movies. Symbols are closed circle for wild type (5 h starved in panel A; 1, 3, 5 and 7h starved in panel B); closed triangle for sgc/gca-null cells, diamond for pla2-null cells; square for sgc/pla2-null cells.

