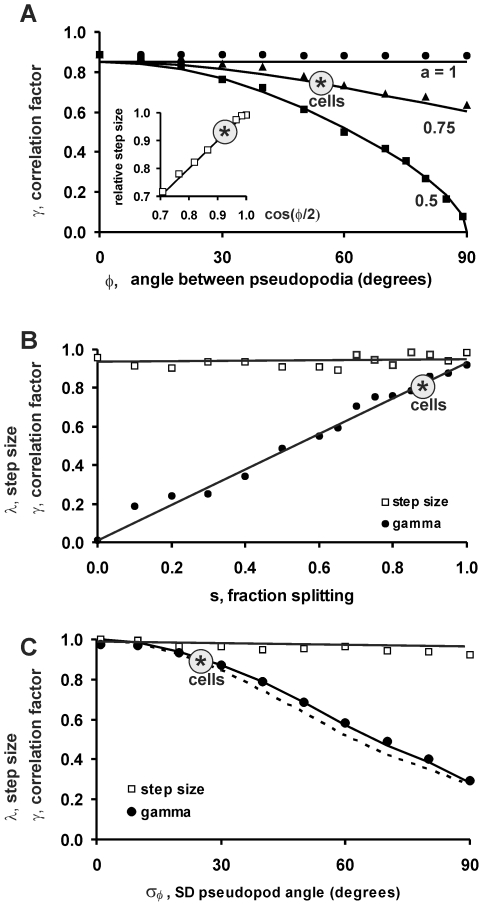
Figure 5. Predicted correlation factor of persistence and step size.
The trajectories of 100,000 cells were obtained by Monte Carlo simulation; the displacement was analyzed with Eq. 4 to obtain the correlation γ MC and step size λ (in units of pseudopod size and thus dimensionless). Simulations were performed with the parameter values as indicated on the x-axis, while the other parameters had the following standard values λ p = 1; s = 1; a = 1; ϕ = 55 degrees; σϕ = 28 degrees. The data points denote the outcome of the Monte Carlo simulations, the lines are generated using Eq. 9, while the dotted line in panel C is generated using Eq. 8. The asterisks represent the predicted value for 5h starved Dictyostelium cells. A. The effect of angle ϕ and right/left bias a (a = 1, all pseudopodia alternating right/left; a = 0.5 right/left is random). B. The effect of the fraction of splitting pseudopodia (s). C. The effect of the variance of the angle between pseudopodia (σϕ).

