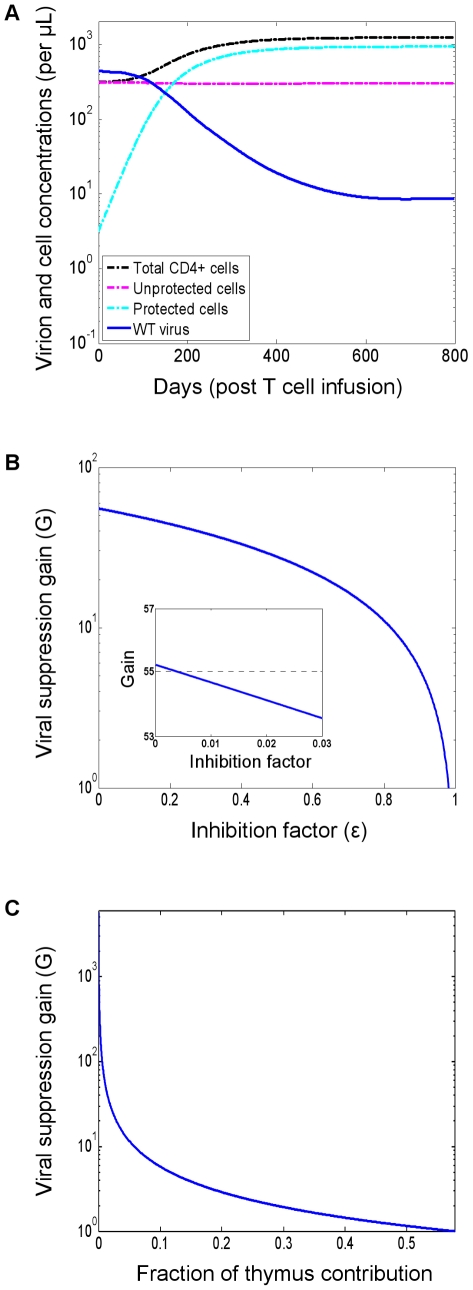
Figure 2. Infection dynamics under gene therapy and the dependence of the viral suppression gain on the inhibition factor and on the thymus contribution.
(A) Dynamics in the absence of viral resistance. Simulations were performed with default parameter values (see the Methods section). (B) The suppression gain (G) is the ratio between the viral loads in the pre-therapy and post-therapy steady states of the baseline model (see the Methods section for an explicit expression). It depends linearly on the inhibition factor  (x-axis) and is depicted on a logarithmic scale. The inset (depicted on a linear scale) demonstrates that decreasing the inhibition factor below a few percent has negligible contribution to viral suppression. The pre-therapy steady state becomes the stable solution when
  is approximately 0.98 (not shown). All parameters were set to their default values (see the Methods section). (C) The thymus' relative contribution (x-axis) is the fraction of the total T-cell mortality that is replaced by the export of mature cells from the thymus, as opposed to by self-proliferation of the T-cell pool. The suppression gain is inversely proportional to it and diminishes quickly. HAART-like gains may be achievable only for diminutive relative contributions. When the contribution is sufficiently large, no viral reduction is obtained, and the pre-therapy steady state becomes the stable solution (not shown). In order to keep the pre-therapy conditions fixed for all points, the proliferation rates and parameters were adjusted to compensate for a varying thymus input. Other parameters were set to their default values (see the Methods section).

