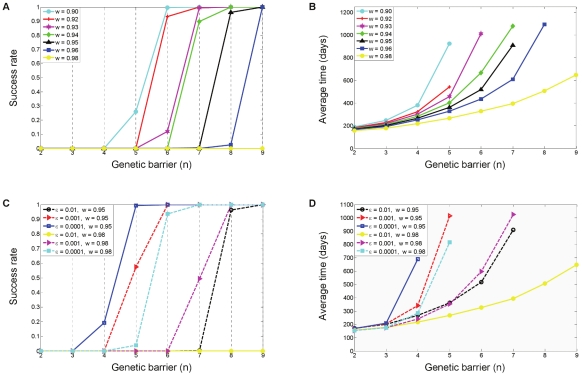
Figure 5. Effects of altering the fitness cost and the inhibition potency on therapy efficacy.
Success rates (fractions of successful treatments) and average fixation times are shown as functions of the genetic barrier  (x-axis) for a range of mutational fitness costs
  (A,B) and for a range of inhibition factors
  (C,D). The data summarize the outcomes of 500 simulation runs per each parameter set, similar to Figure 4. In each panel, different colors are used to depict different parameter values, with black depicting the default case. The plots demonstrate that increasing the fitness cost (lowering
  ) and decreasing the inhibition factor
  both result in prolonged viral suppression. This is manifested in improved success rates and in delayed resistance emergence. Panels C and D depict the effects of varying the inhibition factor for two distinct fitness costs (
 ), illustrating the tradeoff between the two factors. It can be seen that a tenfold increase in inhibition (
 ,
,  ) is as effective as a slight decrease in fitness cost (
 ,
,  ). Panels C and D also point out that minor fitness costs (e.g.,
  ) must be compensated by powerful inhibition (
 ) in order to attain long-term suppression with potentially achievable genetic barriers (
 ).
).

