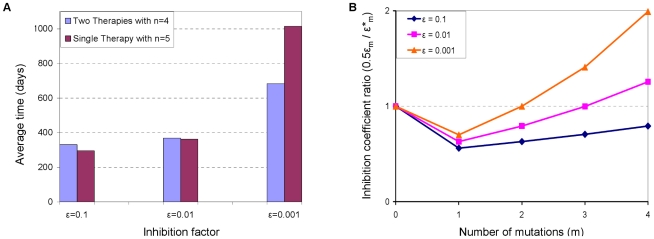
Figure 6. Efficacies of different combinatorial gene therapy strategies.
Two strategies are considered: protecting the entire P cell population with a single gene-based inhibitor whose genetic barrier is  , and dividing the P cell population into two sub-populations, such that each one is protected by a different gene-based inhibitor whose genetic barrier is
  . (A) The efficacies of the two strategies are compared in terms of their resultant average fixation times, for three different inhibition factors (
 ). All other parameters are set to their default values (see the Methods section). The different relations between fixation times that are observed for different
  values suggest that none of the strategies is universally advantageous. Data are based on the outcomes of 500 simulation runs per each parameter set, similar to Figure 4. (B) The ratio between the approximate inhibition levels that each strategy exerts on a given strain is depicted (y-axis) as a function of the number of mutations (m) a strain possesses (x-axis), for each of the three considered
  values. The ratio is greater than one when the single-therapy strategy inhibits a strain more potently than the two-therapy strategy, and vice versa. It can be seen that the ratios correlate with the advantageous strategy, that is, larger ratios pertain to improved performance of the single-therapy strategy.

