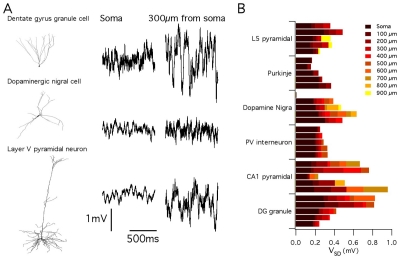
Figure 6. Consequences of stochastic ion channel gating differ between morphologically distinct neuronal cell types.
(A) Examples of membrane potential (right) and corresponding morphology (left) from a simulated dentate gyrus granule cell (top), dopaminergic nigral cell (middle) and cortical layer V pyramidal cell (bottom). All models contained identical ion channel distributions. (B) Average membrane potential standard deviation for model neurons of each morphological type plotted as a function of increasing distance along the dendrite from the soma. The membrane potential standard deviation at a particular location corresponds to the right most end of the bar indicated by the corresponding color. The standard deviation increases with distance from the soma.

