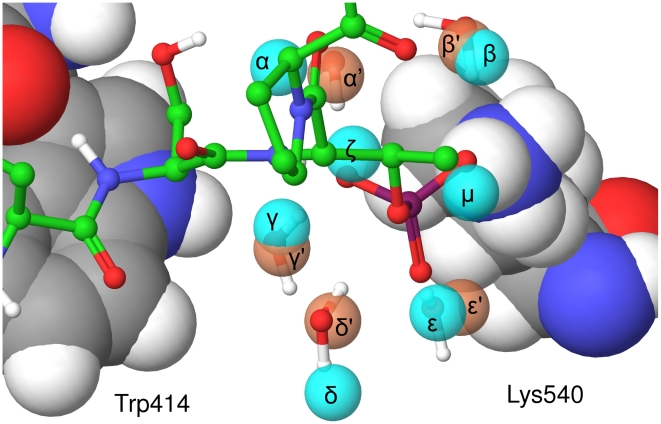
Figure 7. Hydration sites surrounding the phosphate group in the apo state and the phosphopeptide complex.
Hydration sites identified by WaterMap that surround the phosphate group. The hydration sites from the apo state simulation are displayed as cyan balls and labeled α-μ. The hydration sites from the complex simulation are displayed as pink balls and labeled α′–ε′. The phosphopeptide and five water molecule from the crystal structure are displayed as atom colored balls and sticks. PBD binding site residues Trp414 and Lys540 are displayed in atom coloured CPK and labelled.

