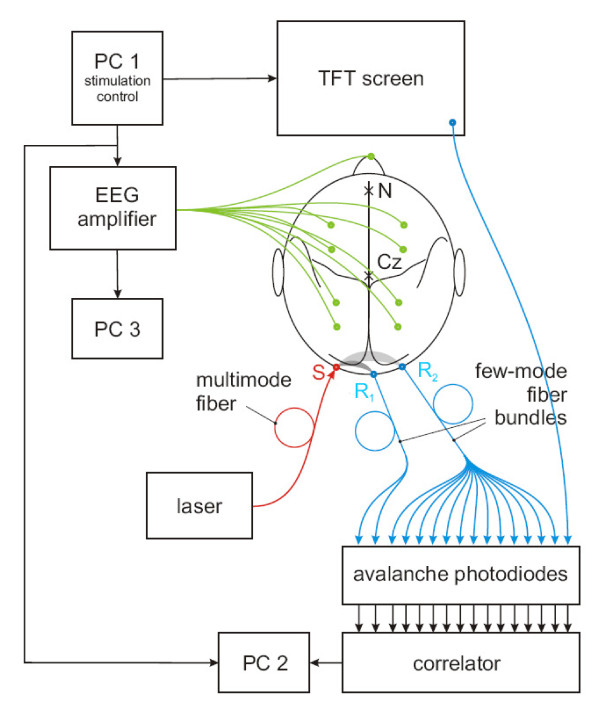
Figure 1.
Experimental setup for simultaneous EEG and DWS measurements. The stimulation sequence delivered by the thin-film transistor (TFT) screen is driven by a personal computer (PC1) that also delivers the trigger signal for the EEG amplifier. The EEG amplifier records the signals from the 17 scalp electrodes and the reference electrode (green). These data are stored on PC3. PC1 also provides the trigger signal for PC2 which controls the 32-channel USB autocorrelator and stores the DWS data. Light from a diode laser operating at 802 nm is directed via a multimode optical fiber (red) onto the source position S on the scalp over the visual cortex of the subject. Receivers R1 and R2 (blue), consisting of bundles of few-mode optical fibers, collect photons which have traveled through the gray-shaded, banana-shaped tissue regions. Within both R1 and R2 the few-mode optical fibers are placed at distances of less than 1 mm in order to detect light intensity fluctuations from equivalent, but statistically independent speckles. Receiver R1 (28 fibers) with a large source-receiver distance of 30 mm probes the volume marked in light grey including parts of the visual cortex; receiver R2 (3 fibers) with a source-receiver distance of 15 mm probes the superficial layers (scalp and skull, dark grey). Receiver R3 records the optical contrast from the TFT screen. N: nasion, Cz: vertex.

