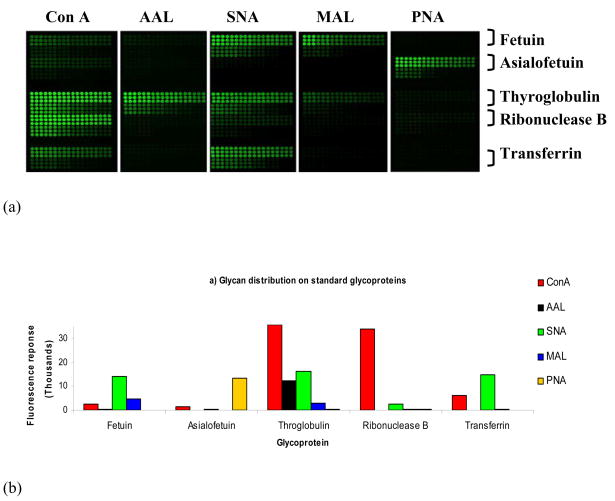
Figure 3. Glycoprotein microarray proof-of-concept experiment utilizing glycoprotein standards.
(A) Scanned images of printed standard glycoproteins (AAL aleuria aurantia, ConA concanavalin A, MAL maackia amurensis II, PNA peanut agglutinin, SNA sambucus nigra [elderberry] bark) probed with various lectins [19•]. Each section contains a standard glycoprotein stated to the right of the section in a dilution series from 2 mg/ml to 0.025 mg/ml. Each dilution was printed as 9 replicates in a 3 × 3 block. (B) Glycan distribution (x-axis) on standard glycoproteins printed at a concentration of 1 mg/ml. Levels are represented by fluorescence response on the y-axis.
(Reprinted with permission from Patwa TH, Zhao J, Anderson MA, Simeone DM, Lubman DM: Screening of glycosylation patterns in serum using natural glycoprotein microarrays and multi-lectin fluorescence detection. Anal Chem (2006) 78(18):6411-6421. © 2007 American Chemical Society).[19•]

