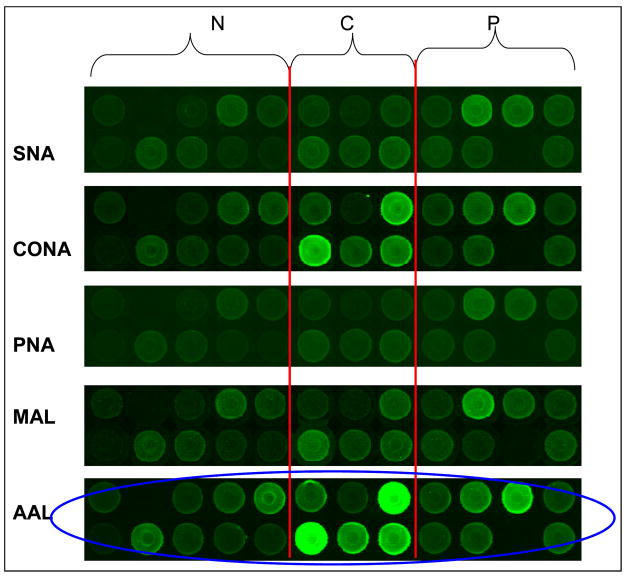
Figure 4. Sample microarray image demonstrating quality of lectin response.
Sections of a glycoprotein microarray in which a peak obtained from non-porous silica reversed-phase high-pressure liquid chromatography column separation is compared across all 24 samples [53]. The lectin probes are shown on the left side of the panel and each panel represents a section from similarly printed arrays. The predominant protein modifications identified in this fraction are mannosylation and fucosylation. AAL aleuria aurantia, ConA concanavalin A, MAL maackia amurensis II, PNA peanut agglutinin, SNA sambucus nigra (elderberry) bark.
(Reprinted with permission from Zhao J, Patwa TH, Qiu W, Shedden K, Hinderer R, Misek DE, Anderson MA, Simeone DM, Lubman DM: Glycoprotein microarrays with multi-lectin detection: Unique lectin binding patterns as a tool for classifying normal, chronic pancreatitis and pancreatic cancer sera. J Proteome Res (2007) 6(5):1864-1874 © 2007 American Chemical Society) [53].

