Figure 1.
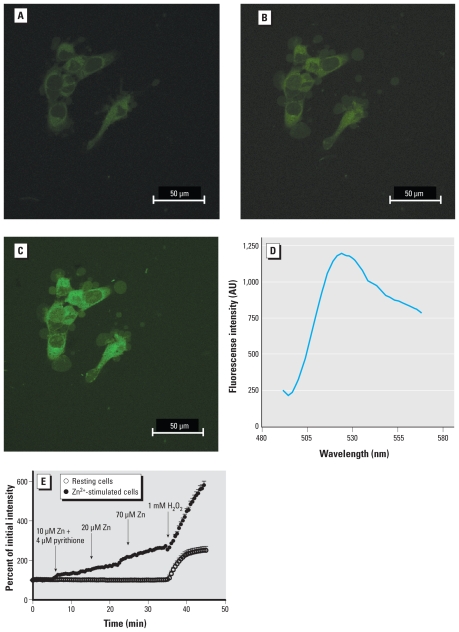
Visualization of zinc-induced H2O2 production by PG1 fluorescence in A431 cells. A431 cells were incubated with vehicle alone for 5 min (A), 100 μM zinc sulfate for 30 min (B), or 1 mM H2O2 given at 45 min (C). (D) Emission spectra confirmation of PG1 fluorescence with peak at 523 nm; intensity is shown in arbitrary units (AU). (E) Time course of H2O2 production detected by PG1 fluorescence in resting cells and in cells stimulated with 10 μM Zn plus 4 μM pyrithione at 5 min, 20 μM Zn at 15 min, or 70 μM Zn at 25 min; H2O2 (1 mM) was added at 35 min as a positive control for both experimental conditions. Triplicate observations were made for control and stimulated cells with an average of 10 cells in each run. Data are mean ± SE.

