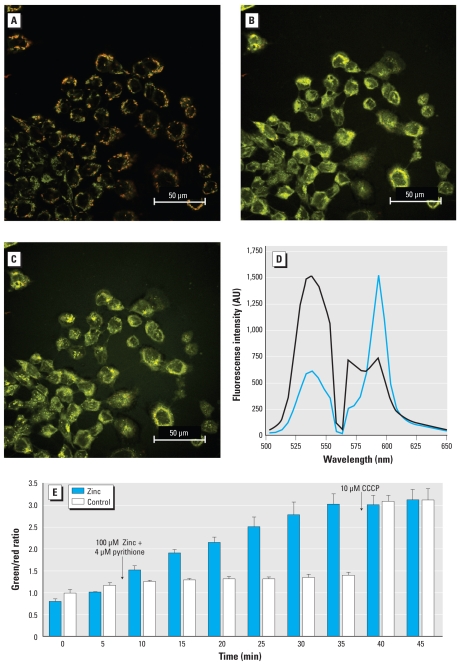
Figure 2.
Measurement of mitochondrial membrane potential visualized by JC-1 in A431 cells treated with zinc. A431 cells treated with vehicle alone (A) or with 100 μM zinc before (B) and after addition of 10 μM CCCP (C) as a positive control. (D) The spectrum of JC-1 is shown under 2 different conditions; control cells (blue line) and depolarized cells (black line). Intensity is shown in arbitrary units (AU). (E) Measurement of JC-1 fluorescence intensity (taken as the ratio of green to red) in control and Zn2+-exposed A431 cells; 100 μM zinc plus 4 μM pyrithione were added at 5 min, and 10 μM CCCP was added to both groups at 35 min. Images were obtained with simultaneous excitation of 488 nm and 561 nm laser and emission scan range between 490 nm and 650 nm using a 5 nm band pass. Triplicate observations were made for control and stimulated cells with an average of 10 cells in each run. Data are mean ± SE.

