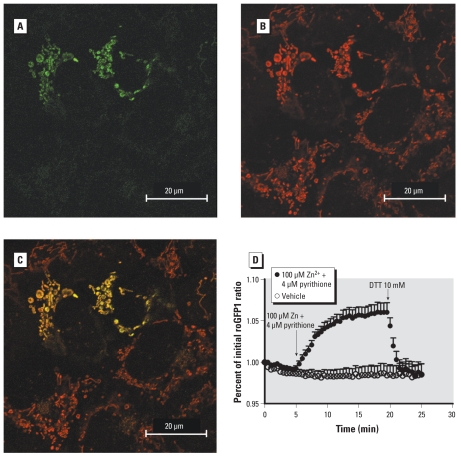
Figure 4.
Zinc-induced oxidative stress in mitochondria. (A) A431 cells transfected with MTroGFP1 demonstrate green fluorescence associated with mitochondria. (B) Cells incubated with the mitochondrial indicator TMRM, shown as red fluorescence. (C) Colocalization of the two images. (D) Mitochondrial redox potential was monitored as the ratio of fluorescence intensity under 404/488 excitation normalized to the value at 0 min; vehicle or 100 μM Zn2+ plus 4 μM pyrithione was added at 5 min. DTT (10 mM) was added at 20 min as a positive control. Data were grouped from 20 cells studied over three separate experiments, expressed as mean ± SE.

