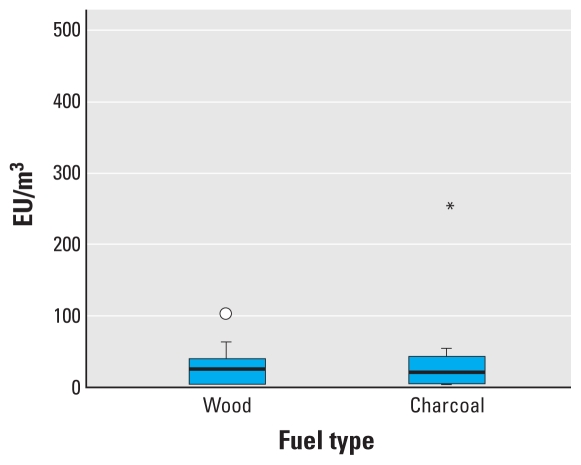
Figure 3.
Box plot of 24-hr airborne respirable endotoxin concentrations by fuel type in Malawian homes. The line inside the box represents the median value, the lower and upper box lines represent the limits of the interquartile range (25th and 75th percentiles), and the “whiskers” represent the 5th and 95th percentiles of the distribution. The circle indicates an outlier observation as described in Figure 2; the asterisk indicates an observation more than three times the interquartile range from the 25th or 75th percentile. Difference in means p = 0.647.

