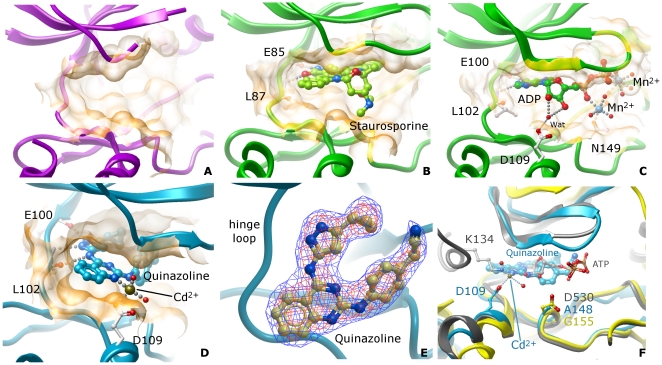
Figure 3. ATP binding site.
Different kinases are color coded as follows: MST1: magenta; MST3: green; MST4: blue. Binding site surfaces are represented by semi-transparent orange skins. A. MST1 apo (PDB ID: 3COM); B. MST3 in complex with staurosporine (PDB ID: 3CKX); C. MST3 in complex with ADP (PDB ID: 3A7J); D. MST4 in complex with a quinazoline inhibitor (PDB ID: 3GGF); E. Fo-Fc difference map of the quinazoline inhibitor bound to MST4 (PDB ID: 3GGF). Isosurface contouring levels: 1σ (blue) and 3σ (red). This view is rotated 90° on the X-axis (as compared to the orientation shown in (D) and looks towards the C-lobe; F. Details of the active site of MST4 in complex with a quinazoline inhibitor (blue), superimposed to PAK6 (yellow; PDB ID: 2C30) and TAO2 in complex with ATP (grey; PDB ID: 1U5R).

