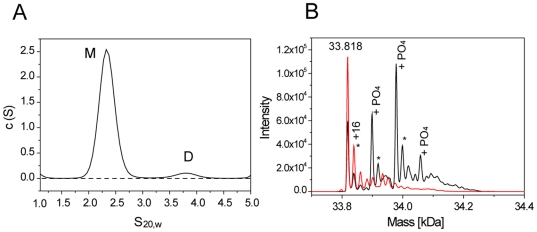
Figure 7. Self association and autophosphorylation of MST4 in solution.
A: Self association studied by analytical ultracentrifugation. Shown are sedimentation velocity data. The sedimentation coefficients have been normalized to standard condition. Peaks corresponding to the MST4 monomer and dimer are indicated by “M and D” respectively. B: Autophosphorylation of MST4 studied by ESI-MS. The mass of the unmodified protein (33.818 Da) has been indicated. In addition to the three detected phosphorylation events the protein also oxidized (+16 mass shifts indicated by *).

