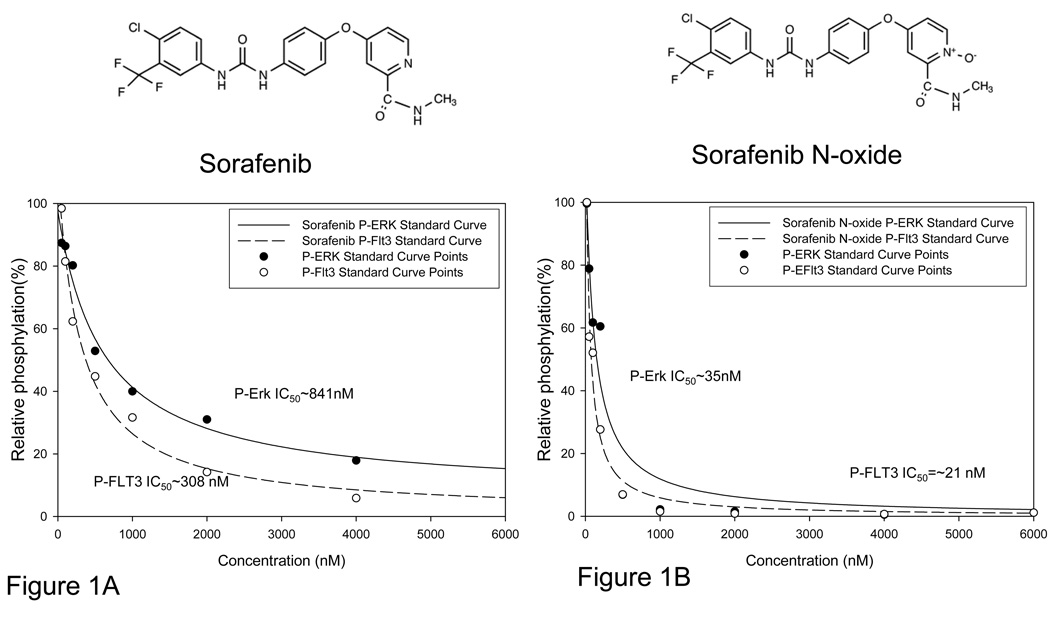
Figure 1. Sorafenib N-oxide is a potent FLT3 inhibitor.
A. Standard curve generated as described previously(17), from western blot of TF-ITD cells in plasma exposed for one hour to increasing concentrations of sorafenib. B. Standard curve generated with sorafenib N-oxide in plasma.

