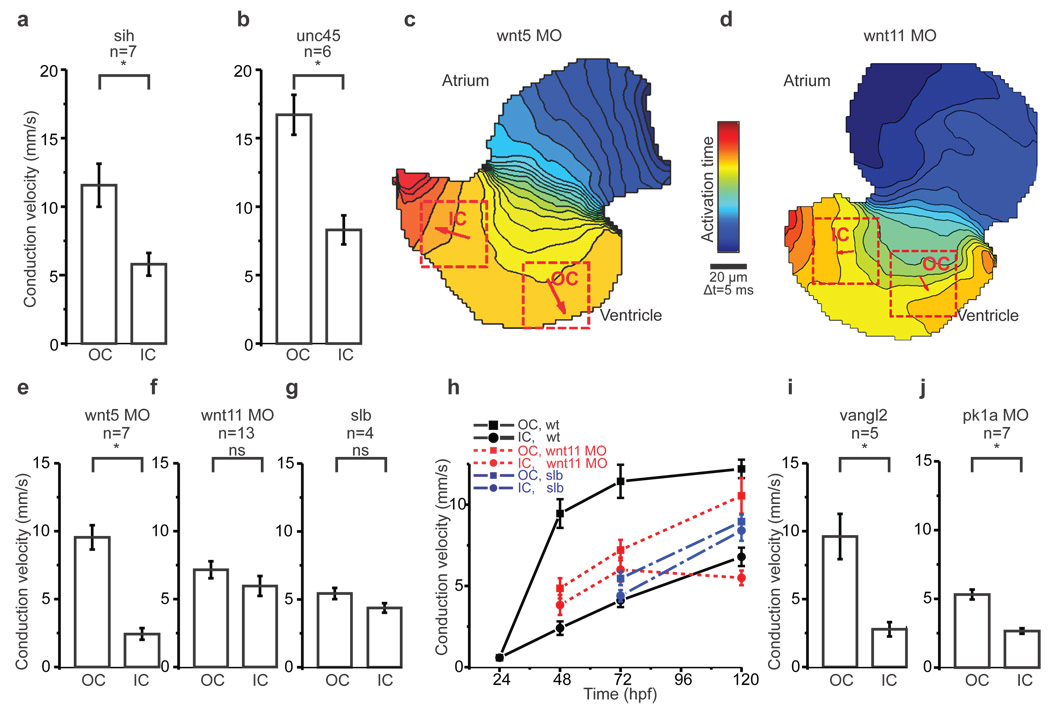
Figure 2. Loss of Wnt11 prevents myocardial electrical gradient formation.
a, b, Mean estimated conduction velocities from silent heart (a), *p<0.05 and unc45 (b), *p<0.05.
c, d, Isochronal maps of hearts from Wnt5 (c) and Wnt11 (d) morphants. The colour code depicts the timing of electrical activation. Squares indicate ROIs for conduction velocity estimation. Arrows depict average velocity vectors in each ROI. OC=outer curvature, IC=inner curvature.
e, f, g, Mean estimated conduction velocities from Wnt5 (e), *p<0.05 and Wnt11 (f) morphants, p=0.22 and silberblick (g), p=0.10.
h, Time course of mean conduction velocities from 24hpf to 120hpf in the outer curvature (OC, squares) and inner curvature (IC, circles) from wildtype (in black), Wnt11 morphants (in red) and silberblick mutants (in blue).
i, j, Mean estimated conduction velocities from vangl2 mutants (i), *p<0.05 and prickle1a morphants (j), *p<0.05.
Student's t-test was used to assess significance in each case. Error bars depict SEM. All experiments were performed at 72hpf.

