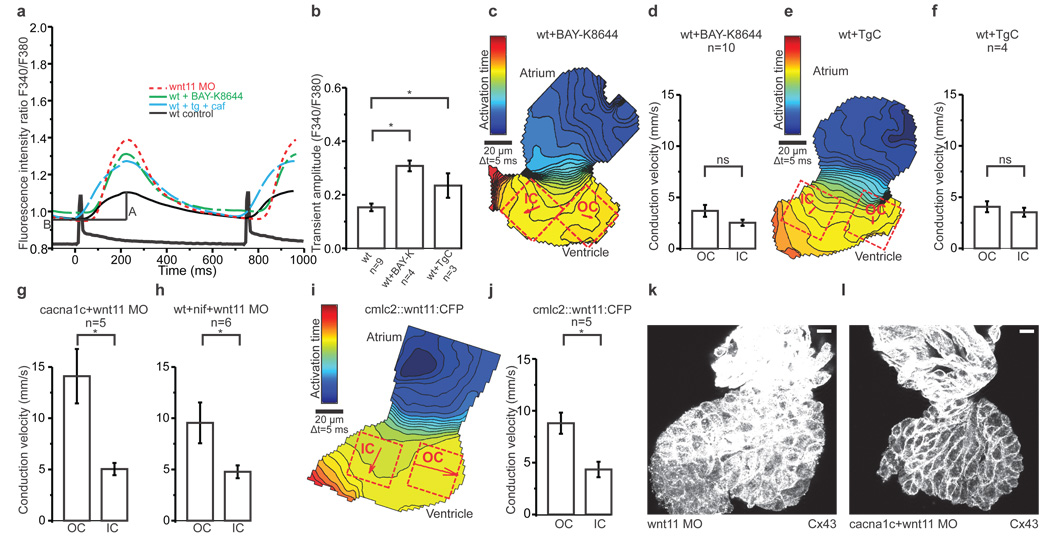
Figure 4. Wnt11 patterns electrical coupling through effects on transmembrane Ca2+ conductance.
a, Averaged Ca2+ transients from ROIs in Figure 3 b, c and Supplementary Figure 5 c, d. A = amplitude and B = baseline.
b, Mean Ca2+ transient amplitudes. One-way ANOVA for comparisons with wildtype, *p<0.05.
c, e, i, Isochronal maps of Bay-K 8644- (c) and thapsigargin+caffeine- (e) –treated hearts and the heart of an embryo injected with 25 µg/µl of clmc2::wnt11:CFP (i). The colour code depicts the timing of activation. Squares indicate ROIs for conduction velocity estimation. Arrows display average velocity vectors. OC=outer curvature, IC=inner curvature.
d, f, g, h, j, Mean estimated conduction velocities from Bay-K 8644- (d), p=0.10, and thapsigargin+caffeine- (f), p=0.47, –treated hearts; hearts from cacna1c embryos injected with Wnt11MO (g), *p<0.05, hearts isolated from nifedipine-treated Wnt11 morphant embryos (h), *p<0.05, and cmlc2::wnt11:CFP injected embryos (j), *p<0.05. Student's t-test was used to assess significance in each case. Error bars depict SEM.
k, l, Z projection of 2µm confocal section from from Wnt11 morphant (k) and cacna1c mutant injected with Wnt11 MO (l), both stained with anti-Cx43. Scale bar = 10 µm. All experiments were performed at 72hpf.

