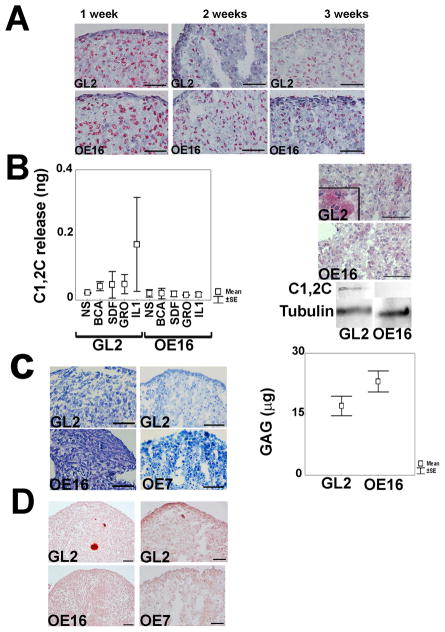
Figure 2. Effects of MMP-13 ablation on ECM remodeling, chondrocyte terminal differentiation and mineralization.
A. Col2 IHC analysis across a micromass maturation time course of 1–3 weeks (bar = 50 μm); B. Left side: ELISA assays for release of type II collagen C1,2C neo-epitopes into 3 week micromass supernatants in response to MMP-13 inductive stimuli. Results were obtained from two different patients (mean+/−SEM); B. Right side: IHC staining and western blotting of C1,2C neo-epitopes in control vs. MMP-13 KD micromasses (1 w); C. Left side: Example of toluidine blue staining for GAG/proteoglycan in control vs. MMP-13 KD (OE16 and OE7) micromasses (3 w) (bar = 50 μm); C. Right side: Cumulative data from 5 different patients of quantitative DMMB assay for sulphated GAG accumulation in controls vs. MMP-13 KD micromasses (3 w). MMP-13 KD micromasses had statistically higher GAG (μg) content compared to control micromasses (p= 0.012). D. Alizarin red staining for calcium deposition in control vs. MMP-13 KD (OE16 and OE7) micromasses (3 w).

