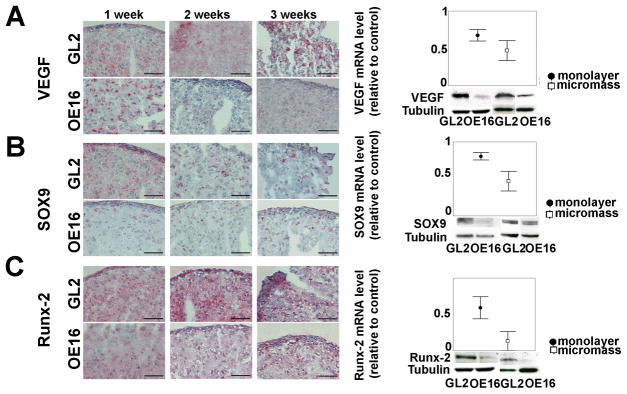
Figure 3. Effects of MMP-13 loss on VEGF and multiple transcriptional regulators of chondrocyte diffentiation in maturing (1–3 week) micromasses.
A. Left side: VEGF IHCs of GL2 control vs. MMP13-KD micromass cultures (bar = 50 μm). A. Right side: levels (mean±SEM) of VEGF mRNA, relative to matched GL2 control mRNA, in high density monolayer (5 patients, with p=0.043) and 1-week micromasses (4 patients, empty boxes); VEGF western blot of high density monolayer and micromasses (3 w); B. Left side: Sox9 IHC of GL2 and MMP-13 KD micromass (bar = 50 μm). B. Right side: levels (mean±SEM) of Sox9 mRNA, relative to matched GL2 control mRNA, in high density monolayer (6 patients, significant difference at p=0.028) and 1-week micromasses (4 patients); Sox-9 western blots of control and MMP-13 KD high density monolayer and micromasses (1 w); C. Left side: Runx2 IHC of GL2 and MMP13-KD micromasses (bar = 50μM). C. Right side: levels (mean±SEM) of Runx2 mRNA, in MMP-13 KD samples relative to matched GL2 controls, in high density monolayer (5 patients, significant difference at p=0.043) and 1-week micromasses (2 patients); Runx2 immunoblots of control and MMP-13 KD high density monolayer and micromasses at 3 weeks.

