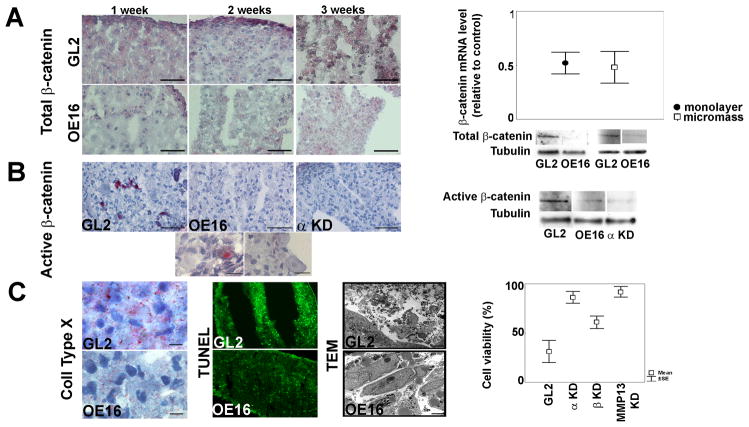
Figure 4. Effects of MMP-13 ablation on β catenin expression and activation, hypertrophy and cell viability.
A. (Left): β-catenin IHCs of GL2 and MMP-13 in differentiating micromasses (bar = 50 μm); A (Right): β-catenin mRNA levels (mean±SEM) in MMP-13 KD vs. matched GL2 controls, in high density monolayer (5 patients, p=0.043) and 1 week (w) micromasses (5 patients, p=0.043). Immunoblots of β-catenin in control vs. MMP-13 KD high density monolayer and micromasses (2w); B (Left): Activated β-catenin in GL2, MMP-13 KD and IKKα KD 3w micromasses (bar =50 μm). Higher magnification GL2 images (bar=12.5 μm) reveal nuclear activated β-catenin and hypertrophic chondrocyte morphology (larger size and lower nuclear/cytoplasmic index); B (Right): Immunoblots of active β-catenin in GL2 control vs. MMP-13 KD and IKKα KD micromasses (3w); C (Left): Collagen X IHC (3w, bar = 18.7 μm), TUNEL fluorescence (2w) and cell morphology by TEM (3w, bar = 2 μm) in GL2 vs. MMP-13 KD micromasses; C (Right): TEM analysis of nuclear morphology and integrity in MMP-13 KD, IKKα KD and IKKβ KD micromasses (5 patients each). MMP-13 KD significantly increases chondrocyte viability over GL2 control micromasses (p= 0.043).

