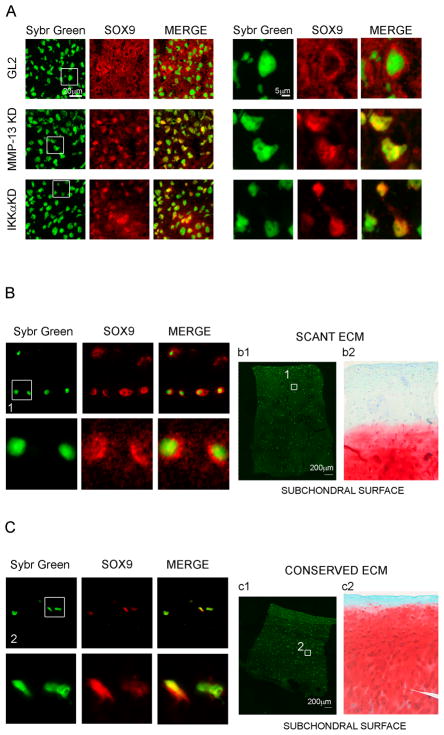
Figure 5. Sox9 subcellular localization in micromasses with and without MMP-13 and IKKα expression and in cartilage tissues with scant vs. more intact ECM.
Confocal microscopy analysis of Sox9 subcellular distribution in 1 week micromasses: Sybr Green nuclear staining, Sox9 staining, and merge. Areas identified by the white square are shown at higher magnification on the right (original images were acquired with a 40× objective in the left panels, and with a 60× in the right panels). Upper row: GL2 control micromasses; middle row: MMP-13 KD micromasses; lower row: IKKα KD micromasses. B and C: Confocal analysis of Sox9 subcellular distribution in the middle zone chondrocytes of degraded cartilage (B) and conserved cartilage (C) (40× and 60× magnifications are shown). The areas of cartilage used for confocal acquisition of scant or conserved cartilage are shown in panels b1 and c1 (sybr green staining only), respectively. Panels b2 and c2 show safranin-O staining in consecutive sections of the same samples used for confocal analysis.

