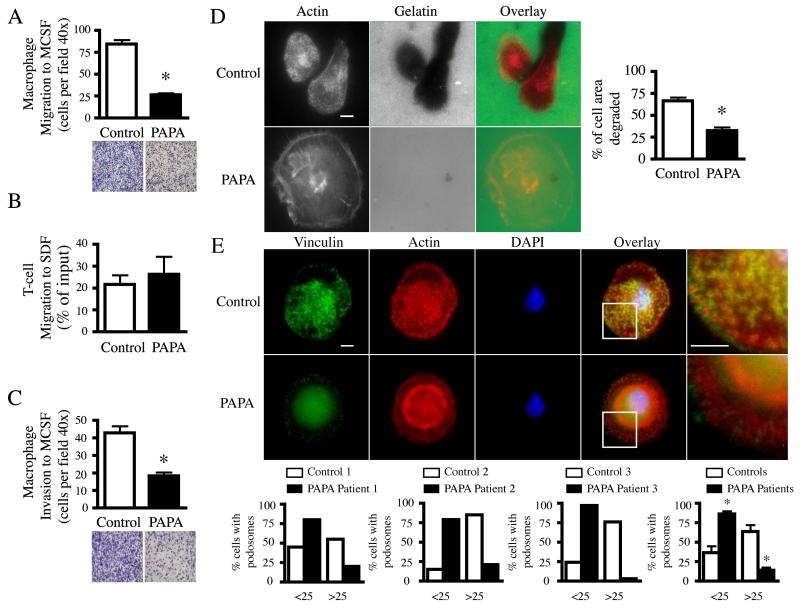
Figure 1. PAPA patient macrophages exhibit decreased invasive migration and podosome formation.
(A) Primary control and PAPA macrophages (1 × 10⁵) or (B) T-cells (2 × 10⁵) were plated on coated (10 μg/ml fibronectin or 10 μg/ml fibrinogen, respectively) transwell membranes in culture media and assayed for their ability to migrate for (A) 24 hr or (B) 3 hr through the membrane to culture media containing 20 ng/ml MCSF or SDF, respectively. Macrophage migration was quantified by counting the number of adherent macrophages on the bottom of the transwell membrane from six separate fields at 40x magnification. A representative field at 10x magnification is shown below. T-cell migration was quantified by flow cytometry and is shown as the percentage of cell input that migrated. Data are mean ± SEM of two independent experiments. *, p < 0.001 compared with control cells by two-tailed, paired, Student’s t test. (C) Primary control and PAPA macrophages (1 × 10⁵) were plated in culture media on Matrigel-coated membranes and assayed for their ability to invade for 48 hr through the membrane to 20 ng/ml MCSF. Macrophage invasion was quantified by counting the number of adherent macrophages on the bottom of the membrane from six separate fields at 40x magnification. A representative field at 10x magnification is shown below. Data are mean ± SEM of three independent experiments. *, p < 0.001 compared with control cells by two-tailed, paired, Student’s t test. (D) Primary control and PAPA macrophages were cultured for 22 hr on Oregon-Green 488 gelatin coated coverslips as previously described (9). Cells were fixed and permeabilized in 4% paraformaldehyde, 0.25 mg/ml saponin for 10 min, quenched with 0.15 M glycine for 10 min and blocked with 10% heat-inactivated FBS containing 0.25 mg/ml saponin. Cells were stained with rhodamine phalloidin as previously described (9). Areas of degradation appear black on the gelatin. Quantification of degradation is shown as a percentage of total cell area from 71 control and 65 PAPA macrophages. Data are mean ± SEM of two independent experiments. *, p < 0.0001 compared with control cells by two-tailed, paired, Student’s t test. Bar 10 μm. (E) Primary control or PAPA macrophages were cultured on 10 μg/ml fibronectin coated coverslips, fixed and permeabilized as in (D) and stained with anti-vinculin (green), rhodamine phalloidin (red) and DAPI (blue) as previously described (9). The white-boxed region of each overlay was magnified 3x and is shown to the right. Bars 10 μm. Images were acquired at 100x and processed as previously described (9). The percentage of control or PAPA macrophages that contained less than or greater than 25 podosomes was quantified for three different PAPA patients (graphs show individual and averaged data). Podosomes were quantified from at least 50 control or PAPA cells in each experiment. Data are mean ± SEM of five independent experiments. *, p < 0.007 compared with control cells by two-tailed, paired, Student’s t test.

