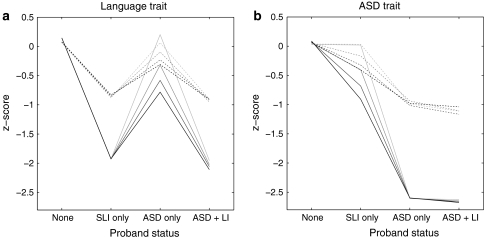
Fig. 4.
Simulated data from correlated additive risks model showing mean scores for probands (unbroken lines) and their first degree relatives (dashed lines) in relation to proband diagnosis, for 10-gene model, with 0, 2, 4 or 6 pleiotropic genes, denoted by shading from pale grey (0 pleiotropic) to black (6 pleiotropic). Relatives who meet criteria for ASD are excluded from the means. SLI specific language impairment, ASD autism spectrum disorder, ASD+LI ‘comorbid’ cases

