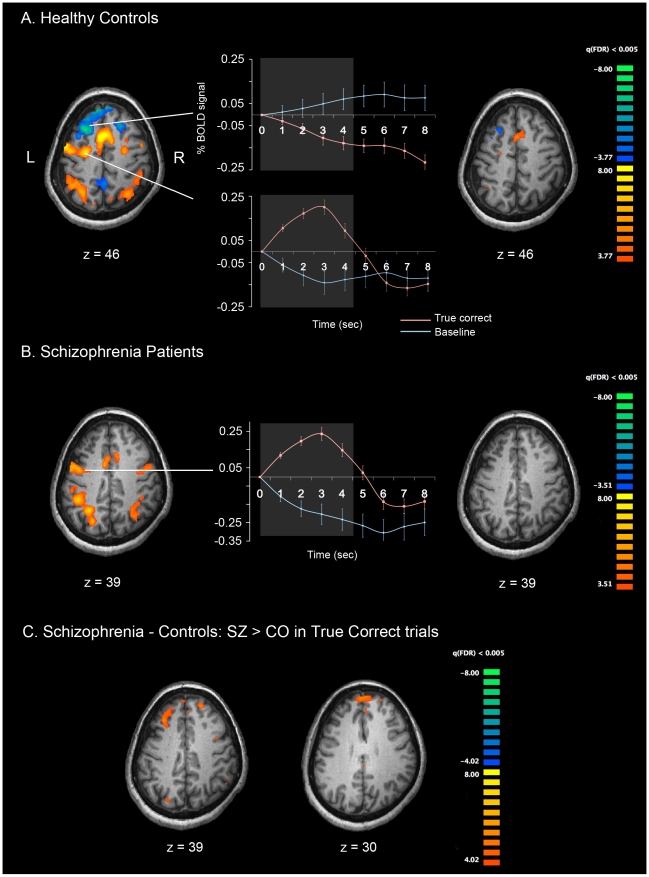
Figure 2. Cortical activation patterns during verbal WM maintenance for the two groups.
Healthy controls (A), patients with schizophrenia (B), and significantly different activation between groups (subtraction of SZ-CO) (C) are shown. The time series plots in the middle column show activation associated with true memory maintenance (red lines) relative to the baseline activities (blue line). Bright parts in the middle of each plot represent 1-volume (1.5 s) after onset, and offset of the maintenance phase (4.5 secs). All p-values are corrected with false discovery rate of q<0.005.

