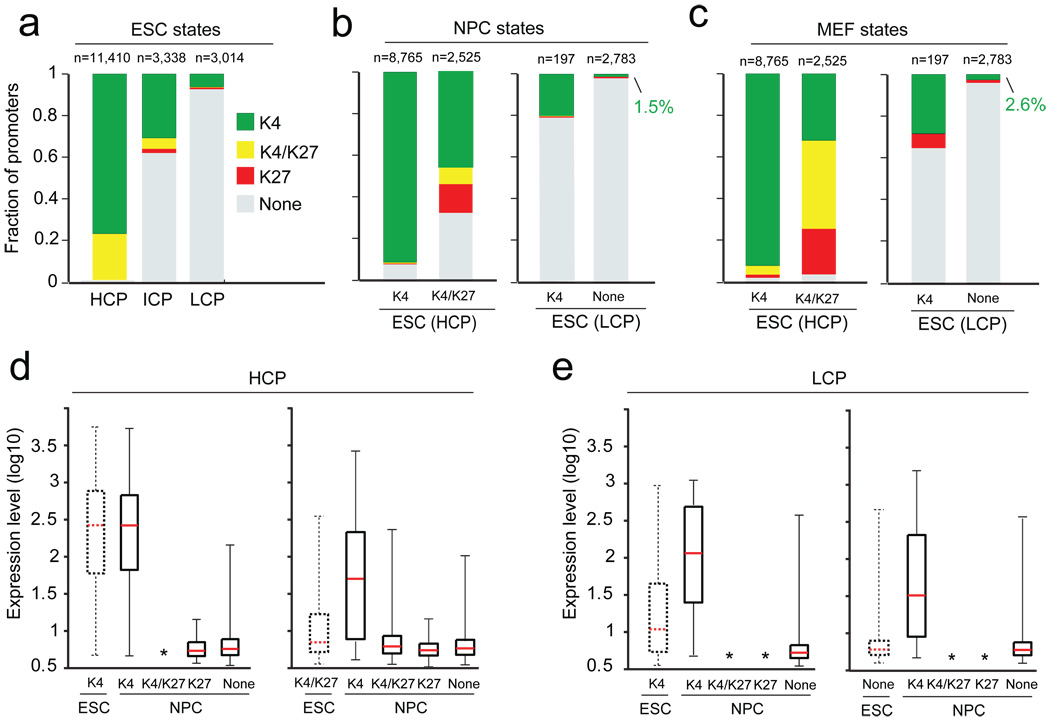
Figure 2. Histone tri-methylation state predicts expression of HCP and LCP promoters.
(a) Mammalian promoters can be readily classified into sets with high (HCPs), intermediate (ICPs) or low (LCPs) CpG-content. In ES cells (ESCs), virtually all HCPs are marked by H3K4me3, either alone (green) or in combination with H3K27me3 (yellow). In contrast, most LCPs have neither mark (grey). Few promoters are only enriched for H3K27me3 (red). (b) Tri-methylation states of HCPs and LCPs in NPCs (indicated by colors), conditional on their ESC state (indicated below each bar). HCPs marked by H3K4me3 only in ESCs tend to retain this mark. HCPs marked by H3K4me3 and H3K27me3 tend to lose one or both marks, although some remain bivalent. Small, partially overlapping subsets of LCPs are marked by H3K4me3. (c) Tri-methylation states of HCPs and LCPs in MEFs. (d) Changes in expression levels of HCP genes with H3K4me3 alone (left) or also with H3K27me3 (right) upon differentiation to NPCs. Resolution of bivalent promoters to H3K4me3 is associated with increased expression. Boxplots show median (red bar), 25th and 75th percentile expression levels in ESCs. Whiskers show 2.5th and 97.5th percentiles. Asterisks indicate classes with less than 15 genes. (e) Changes in expression levels of LCP genes with H3K4me3 (left) or no mark (right) upon differentiation to NPCs. Gain of H3K4me3 is associated with increased expression.

