Figure 1.
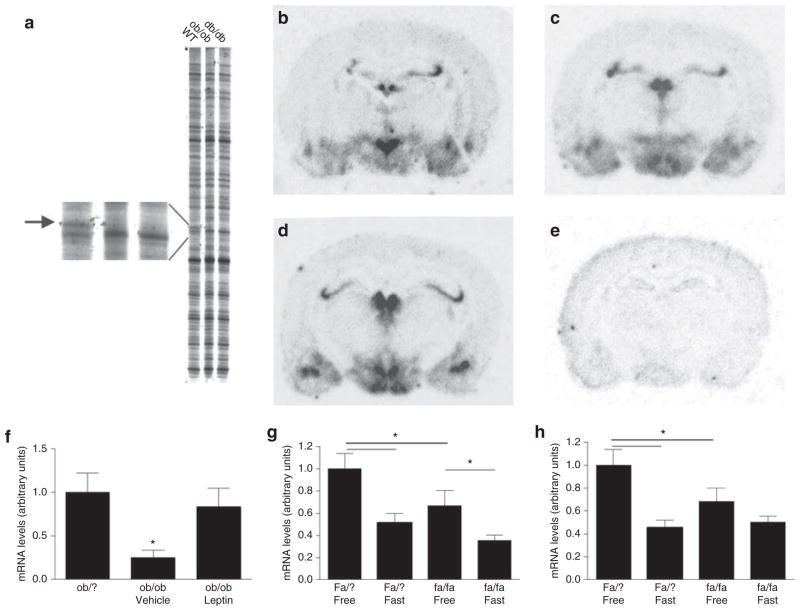
Hypothalamic Nnat mRNA expression. (a) Image from part of the RFDD analysis showing the gene fragment representing neuronatin (586–669 base pairs, Gb: AK003004) downregulated (absent) in ob/ob and db/db mice. (b–d) Radioactive ISH with antisense probe on rat hypothalamus (b, PVN; c, VMH and Arc; d, Arc and DMH). (e) Radioactive ISH with sense probe. (f) Nnat mRNA levels in the DMH and LHA of lean Ob/? mice, and in vehicle- or leptin-treated ob/ob mice. (g,h) Nnat mRNA levels in lean and obese Zucker rats showing reduced Nnat mRNA expression in the DMH (g) and PVN (h) of leptin receptor–deficient and fasted animals. Data in f–h are means ± s.e.m.; asterisk indicate P < 0.05 (ANOVA followed by Fisher’s post hoc test or Student’s t-test). DMH, dorsomedial hypothalamic nucleus; ISH, in situ hybridization; LHA, lateral hypothalamic area; PVN, paraventricular nucleus; RFDD, restriction fragmented differential display.

