
Fig. 5.
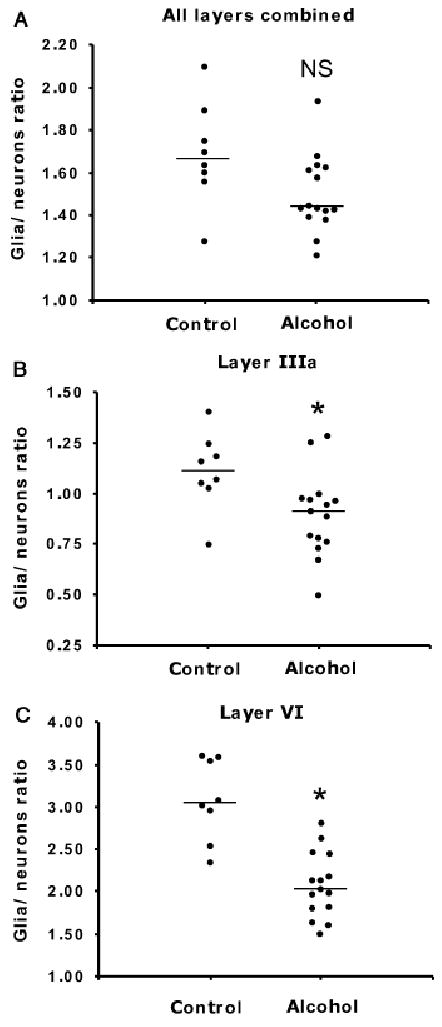
Plots illustrating average individual values of the ratio of glial cells to neurons in controls and alcoholic subjects in all cortical layers combined (A), layer IIIa (B), and layer VI (C). In (A), NS indicates nonsignificant; p = 0.068. *Significant differences after ANCOVA using age, postmortem interval, time in formalin, and tissue pH as covariates: in (B) p = 0.026, in (C) p = 0.002.