Fig. 5.

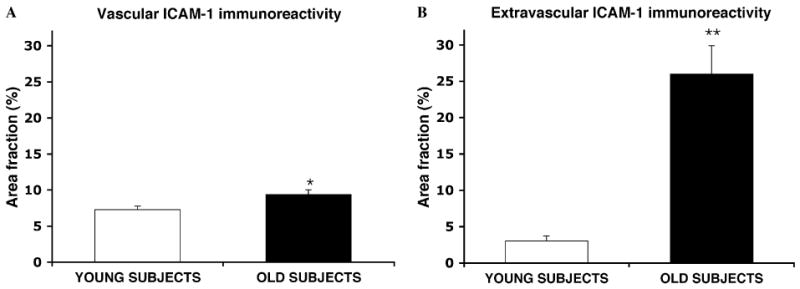
Bar graphs representing the area fraction of ICAM-1 immunoreactivity in structures with vascular morphology (vessels) (A) and in extravascular patches of ICAM-1 immunoreactivity (B). X axis legends as in Fig. 3. *p < .01, **p < .00001.

Bar graphs representing the area fraction of ICAM-1 immunoreactivity in structures with vascular morphology (vessels) (A) and in extravascular patches of ICAM-1 immunoreactivity (B). X axis legends as in Fig. 3. *p < .01, **p < .00001.